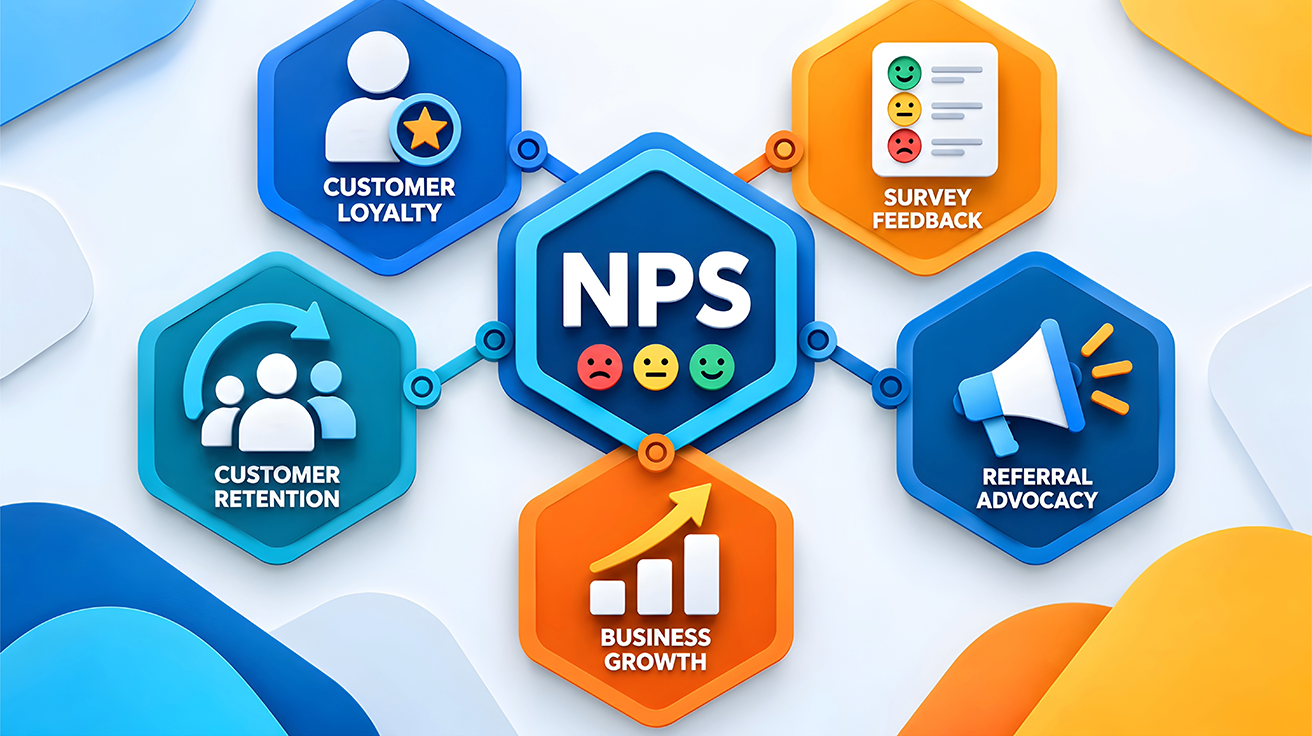
A Net Promoter Score survey can tell you more than a single overall score. It can help a market research company compare customer groups and spot differences that would otherwise go unnoticed. Customers who have used a service for several years, for example, may be more willing to recommend it than those trying it for the first time. Looking at these groups separately gives businesses a clearer view of customer loyalty and shows where further research is needed.

Net Promoter Score (NPS) measures how likely customers are to recommend a business, product, or service. Customers rate their likelihood on a scale of 0 to 10, and their answers fall into three groups:

  • Detractors (0–6): Customers who are less likely to recommend the business and may have concerns about their experience.
  • Passives (7–8): Customers who are neither strongly positive nor negative and may consider other options.
  • Promoters (9–10): Customers who are more likely to recommend the business to others.

Looking beyond the overall score gives businesses a clearer view of different customer experiences. It also helps them focus their research and improvement work where it will matter most.

Why Is One Overall NPS Not Always Enough?

NPS is simple. An overall score is a good starting point, but it’s an average, and averages blur things. Take a clinic group with an overall NPS of +40. That sounds healthy. Yet one branch might sit at +70 while another sits at +5, and the average hides both. That’s why good customer loyalty measurement looks at the detail underneath the number, not just the number itself.

What Does Customer Segmentation Mean in NPS Research? 

Customer segmentation means dividing customers into smaller groups based on shared characteristics or experiences. A market research firm can apply the same NPS framework to each group and compare the results.

A retail business, for example, may compare first-time shoppers with regular customers to understand whether their shopping experiences differ. It may also compare customers who purchase different product categories to identify variations in customer loyalty.

This turns a single score into a more detailed picture of customer loyalty. Instead of only asking whether customers are satisfied, businesses can ask which customers are most likely to recommend the service, where the differences are, and what needs a closer look.

Which Customer Groups Can a Market Research Company Compare?

The groups should match the business question. Comparing too many unrelated groups makes the findings hard to interpret, so researchers should focus on segments that can support a clear business decision.

Common comparisons include:

  • New and returning customers: Find out whether first-time customers feel as confident about the business as those who have used it before.
  • Different products or services: Compare customer loyalty across service lines, product categories, or healthcare departments.
  • Customer tiers: Check whether customers on different service packages or membership levels report different experiences.
  • Branches or locations: See whether customers get a consistent experience across different outlets or facilities.
  • Relevant demographic groups: Compare age groups or other customer characteristics when they relate directly to the research objective and are appropriate to collect.

In healthcare research, comparisons may cover first-time and repeat patients, users of different departments, or patients who book different appointment types. The aim is to find differences that matter without collecting personal information the research doesn’t need.

How Is a Net Promoter Score Survey Set Up to Compare Customer Groups?

A well-planned survey makes group comparisons easier and more dependable. Researchers need to decide which groups matter before collecting responses, rather than trying to build useful segments after the survey has closed.

Experienced NPS survey companies in UAE will usually: 

  • Define the customer segments: Decide which groups will be compared and why the comparison matters to the business.
  • Choose relevant profile questions: Collect only the details needed to classify respondents, such as customer status, service used, or branch visited.
  • Keep the core question consistent: Use the same recommendation question, rating scale, and wording across all groups.
  • Apply consistent collection methods: Keep the survey timing and contact approach as similar as practical, so the research process doesn’t cause differences of its own.
  • Plan the analysis in advance: Decide how results will be reported and which differences need further investigation.

Why Does Sample Size Matter When Comparing NPS Results?

A customer group needs enough responses for its NPS to say something useful about customer sentiment. When only a few people respond, one or two ratings can swing the result significantly.

For example, if only two customers respond to a retail store’s survey, their ratings may not reflect the overall shopping experience of its wider customer base. A larger set of responses gives a more balanced picture, although the quality of the sample matters too. 

Researchers should check how many completed surveys each segment has and whether the respondents represent the wider customer group.

There’s no single sample size that suits every project. The right number depends on the size of the customer population, the level of precision needed, and the differences the research is trying to detect. When the results will guide major business decisions, researchers can plan sample sizes around those needs.


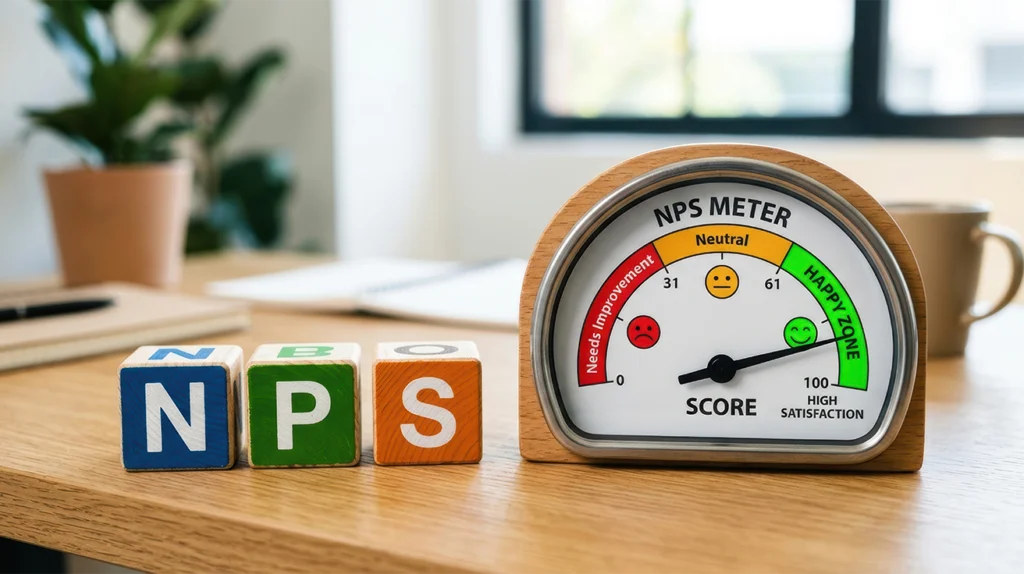
Net Promoter Score survey meter displaying customer satisfaction levels, with NPS blocks and a gauge indicating customer loyalty.

What Can Differences in NPS Scores Reveal About Customer Groups?

Comparing scores shows which groups are more likely to recommend a business and which may need attention. The split between Promoters, Passives, and Detractors adds context to the overall result.

Researchers calculate the score with this formula:

NPS = % Promoters − % Detractors

Passives count toward the total responses but don’t affect the calculation directly.

Here is an illustrative example:

Customer groupPromotersPassivesDetractorsNPS
New customers50%30%20%+30
Returning customers65%20%15%+50

Illustrative figures only.

In this example, returning customers score +50 and new customers +30. The scores show that one group is more likely to recommend the business, but they don’t say why. A market research company can look into possible reasons by examining customer feedback and the service experiences involved.

Researchers should also consider sample size and statistical significance before treating differences between customer groups as meaningful. Small variations may result from sampling differences rather than actual changes in customer sentiment.

The split matters too. A large share of Passives may mean many customers have a neutral experience and no strong reason to recommend the business. A higher share of Detractors may point to concerns that deserve a closer look.

How Can Open-Ended Feedback Explain Differences Between Customer Groups?

NPS scores show where customer groups differ, and customer comments help explain why. A follow-up question such as “What is the main reason for your score?” lets respondents describe their experience in their own words.

New customers may mention difficulty booking a service, for instance, while returning customers appreciate the support they get from staff. Customers at another branch might report long waiting times or unclear communication.

Researchers can group these comments into common themes and compare them across segments. Combining customer satisfaction research with NPS results helps businesses understand what is behind the scores and which improvements matter to each group.

It also stops every low score from being treated as the same problem. And it highlights what’s working, such as helpful staff, clear communication, or a smooth appointment process, so those things are kept.

What Actions Can Businesses Take After Comparing NPS Results?

NPS research is only worth the effort if the findings lead to better customer experiences. Once the results and feedback have been reviewed, businesses can turn them into specific actions.

  • Prioritise the most important improvements: Start with issues that affect customer experience and support wider business goals.
  • Address concerns raised by specific groups: If new customers report booking difficulties, review the booking process rather than changing unrelated services.
  • Assign responsibility for follow-up: Give each improvement a clear owner, a target date, and a way to measure progress.
  • Follow up with customers when appropriate: Where permission and contact arrangements allow, respond to concerns and explain what is being done.
  • Measure the results again: Repeat the survey after changes are in place to see whether customer perceptions have improved.

Businesses should avoid acting on one score alone. Reviewing feedback, operational information, and follow-up results gives them more confidence in the decision.

What Common Mistakes Should Researchers Avoid When Comparing NPS Results?

Even well-designed research can lead to the wrong conclusions if the comparison isn’t handled carefully. Watch for these common mistakes:

  • Creating too many segments: Over-segmenting can leave each group with too few responses to be useful.
  • Changing survey methods between groups: Different wording, timing, or collection methods can influence responses and weaken the comparison.
  • Ignoring customer circumstances: Customers have different needs, expectations, and reasons for using a service, and that affects how their scores should be read.
  • Assuming the score explains the problem: NPS shows patterns, but extra feedback or research is often needed to understand the causes.
  • Overlooking small samples: Small samples can produce unstable scores, making apparent differences between customer groups less reliable. 

Careful interpretation keeps businesses from making unnecessary changes and helps them focus on findings that support sound decisions.

Conclusion

Comparing customer groups through a Net Promoter Score survey shows where customer loyalty is stronger, where concerns may exist, and which experiences deserve a closer look. For businesses across the UAE, these findings can help identify differences in customer experience across branches, products, service teams, and customer segments. 

Think Positive, a customer research consultancy in UAE, provides market research services to help businesses compare customer feedback, understand differences between customer groups, and find practical areas for improvement. Contact our research team to discuss your NPS research requirements and plan an approach that fits your business goals.

Frequently Asked Questions (FAQs):

How can a market research agency help with NPS analysis?

A market research agency can compare customer groups, analyse feedback, and identify practical ways to improve customer loyalty.

NPS is calculated by subtracting the percentage of Detractors from the percentage of Promoters.

Comparing scores helps businesses identify differences in customer loyalty and find areas that need improvement.

They can review customer feedback, address common problems, and measure results after making changes.

Related Posts